Unsupervised Risk Modeling with K-Means on AMI Smart Meter Data
This project uses k-means clustering to segment smart meters into behaviorally similar groups based on engineered features derived from high-frequency AMI measurements. The result is a practical segmentation layer that utilities can use to prioritize monitoring, investigate power-quality issues, and support reliability workflows when labeled outage data is limited.
The clustering output is designed to be interpretable: each cluster has a distinct feature “fingerprint” that maps to operational narratives such as stable baseline meters, demand-driven variability, and power-quality volatility.
Background & Problem Statement
Utilities ingest massive volumes of AMI data at high cadence. While this data offers rich visibility into customer load and grid conditions, extracting actionable signals at scale is challenging without labels.
Problem Statement: Can we use unsupervised learning to segment meters into interpretable groups that help identify potential reliability risk and power-quality instability without requiring outage labels?
Dataset
The workflow uses real high-frequency smart meter data containing timestamped measurements of energy (kWh), voltage, current, and frequency. Measurements were resampled to a 30-minute interval to reduce noise while retaining operational patterns.
Source: Harvard Dataverse — “High frequency smart meter data from two districts in India (Mathura and Bareilly)” (Agrawal et al., 2021).
Feature Engineering
Rather than clustering raw time series, each meter was represented as a single feature vector summarizing behavior over time. This is typical for operational AMI analytics where the goal is scalable fleet segmentation.
- Load behavior: mean kWh, variability (CV), ramp metrics (mean and p95).
- Voltage stability: mean voltage, voltage variability, voltage ramping.
- Frequency stability: percent of measurements outside nominal tolerance band.
- Electrical stress & coupling: mean and peak current, voltage–current correlation, energy–voltage correlation.
K-Means Clustering & Model Selection
K-means was evaluated across multiple cluster counts using the elbow method (inertia) and silhouette score. The final selection of k = 4 balances diagnostic signals with operational interpretability.
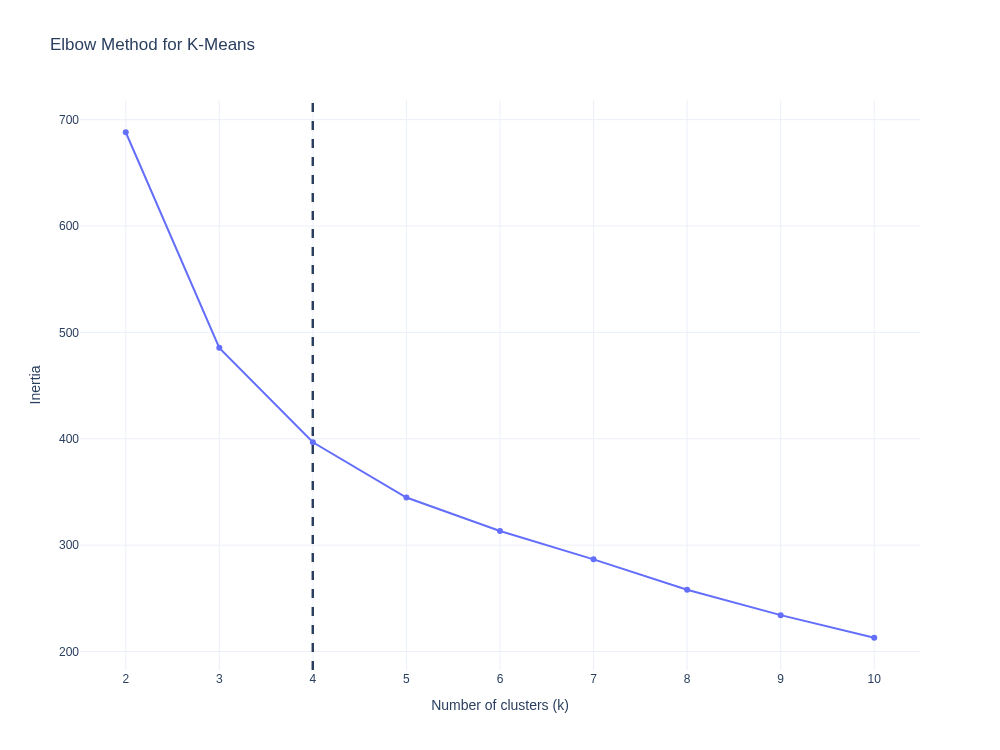
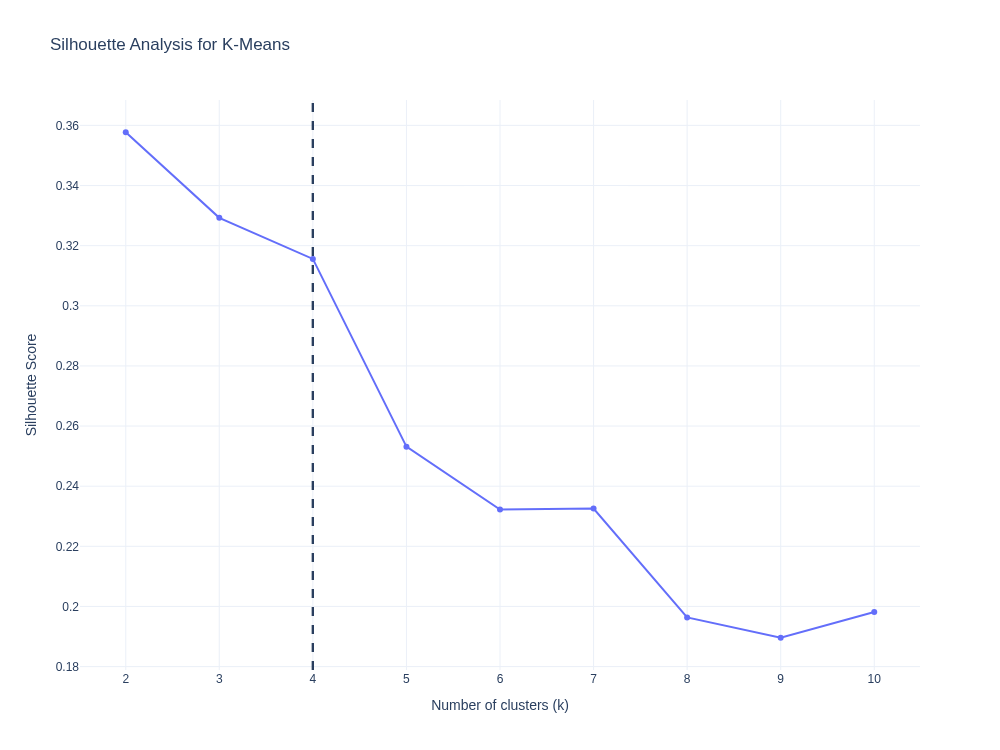
Silhouette values indicate moderate separation, which is common in real AMI behavioral data where meter characteristics vary along a continuum. The focus here is interpretability and operational usefulness rather than perfectly separable clusters.
Cluster Membership Summary
The table below summarizes cluster membership, showing how individual smart meters group into behaviorally distinct cohorts based on load dynamics and power-quality characteristics.
| Cluster ID | Cluster Description | # Meters | Meter IDs |
|---|---|---|---|
| 0 | Stable Baseline | 24 | BR02, BR03, BR05, BR07, BR08, BR09, BR10, BR11, BR13, BR14, BR15, BR16, BR17, BR19, BR20, BR22, BR27, BR28, BR29, BR30, BR49, BR50, BR51, BR52 |
| 1 | Demand-Variable (Low Load) | 8 | BR33, BR34, BR39, BR42, BR43, BR44, BR46, BR48 |
| 2 | Power-Quality Volatile | 6 | BR32, BR35, BR36, BR37, BR38, BR45 |
| 3 | High-Load, High-Ramping | 8 | BR04, BR06, BR12, BR18, BR23, BR24, BR26, BR31 |
Results & Cluster Interpretation
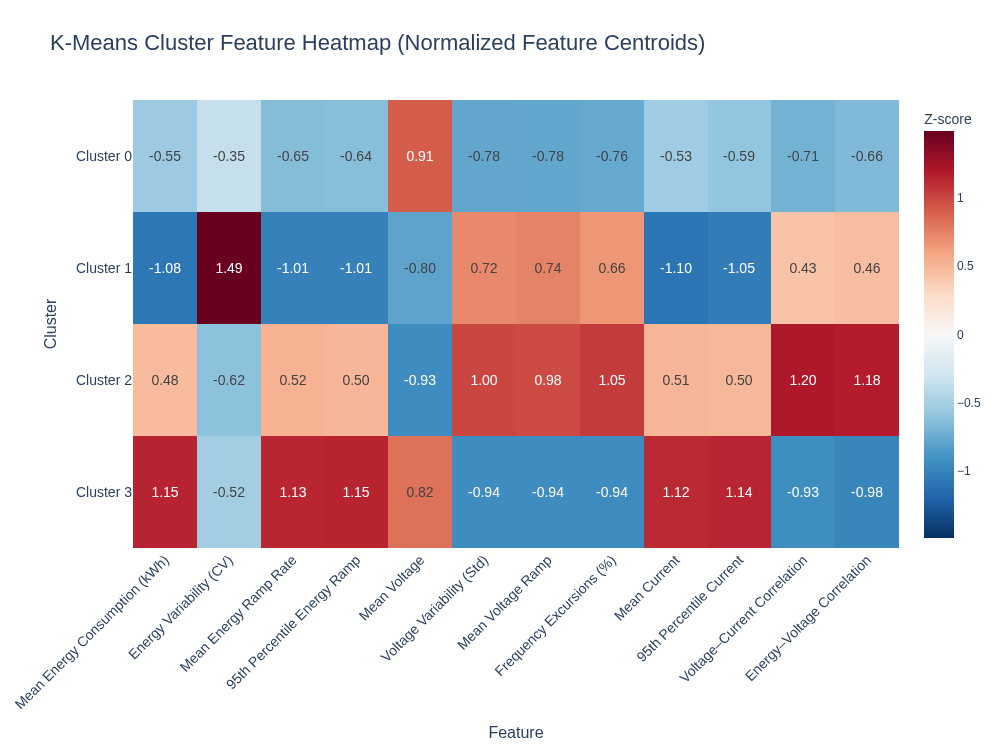
The heatmap below shows normalized (z-score) cluster centroids. Red indicates above-average behavior, blue indicates below-average behavior, and white indicates near-average behavior relative to the full meter population.
- Cluster 0 — Stable Baseline: low load variability with stable voltage and frequency; low monitoring priority.
- Cluster 1 — Demand-Variable (Low Load): low average usage but high relative variability; consistent with customer-driven intermittency.
- Cluster 2 — Power-Quality Volatile: elevated voltage variability, frequency excursions, and stronger coupling signals; candidate group for feeder/transformer investigation.
- Cluster 3 — High-Load, High-Ramping: high consumption and rapid load changes with stable power quality; relevant for capacity planning and peak stress amplification.
Operational & Business Value
This project demonstrates how unsupervised segmentation can translate AMI telemetry into actionable monitoring workflows:
- Prioritize investigation: focus engineering attention on power-quality volatile meters (e.g., Cluster 2).
- Targeted monitoring: establish behavior-based cohorts for ongoing alerting and dashboarding.
- Foundation for predictive models: use cluster membership as a feature for future outage prediction and asset health models.
- Scalable fleet analytics: move from meter-level inspection to cohort-level decision making.
Github Repository
The full, reproducible implementation for this project — including data preprocessing, feature engineering, k-means clustering, and visualization — is available on GitHub.
🔗 View Project Repository on GitHub
The repository includes Jupyter notebooks, engineered feature tables, cluster assignments, and documentation to support reproducibility and further extension.